
Ion
Nasdaq gap reversals · 5-minute
- Won per $1 lost, 2024–26 data
- $1.91
- Worst drop
- 5.7%
- Best on funded accounts
- Funded
- Losing years
- 0
Hypothetical backtest on a $100,000 account.
Account growth$100,000 account, after costs. Hypothetical backtest.
Build years (2019 to 2023)2024–26 data, hatchedDeepest drop: −5.7%, Jun 2020 to Jan 2021
Return in each year% of a $100,000 account
* Part year: the bot's data starts after mid-January. Hatched bars are part years. The current year is marked "so far".
Prop firm challengesimulated 2-step challenge
Challenge details
- Measure
- Challenge mode
- 1% risk
- Passed the challenge
- 100%
- 100%
- Typical time to pass (median)
- ~1 year
- ~2 years
- 3 in 4 passed within
- ~2½ years
- ~2½ years
- Failed (hit a loss limit)
- 0%
- 0%
- Passed on starts from 2024 to 2026
- 100%
- 100%
Setting 2.25% risk per trade, half risk after a 3% drawdown
1% risk every trade risks 1% of the account. No daily stop, no drawdown throttle, no profit cushion.
Simulated 2-step prop-firm challenge on past data from a flat account, no time limit. Not a guarantee. Prop firms may restrict many traders running the same bot — check your firm's rules. 1% risk = every trade risks 1% of the account. Portfolio bots are shown at their standard setting.
More detail
Every table behind the numbers. Open what you need.
All the numbersWin rate, average trade, worst day and more
All the numbershow it performs
| Won per $1 lost, 2024–26 datathe profit factor | $1.91 |
|---|---|
| Won per $1 lost, all years2019 to Sep 2026 | $1.80 |
| Win ratetrades that made money | 50% |
| Trades per yearall markets together | 17 |
| Trades a monthall markets together | 1.4 |
| Average trade% of the account, after costs | +0.42% |
| Average holdtime in each trade | 16 minutes |
| Growth per yearaverage gain, no compounding | +5.8% |
| Profitable monthsmonths that ended up | 46% |
Won per $1 lost is the profit factor. 2024–26 data runs from 2024 to Sep 2026. Worst drop is the deepest drop from a peak, 2019 to 2026.
All the numbersrisk and prop-firm results
| Worst dropdeepest drop from a peak | −5.7% |
|---|---|
| Worst-case dropbad-luck case, 5,000 simulations | −11.2% |
| Worst daybiggest one-day loss | −2.16% |
| Losing yearscalendar years that lost money | 0 |
| Markets and timeframewhat it trades | Nasdaq 100 · 5-minute |
| Risk per trade usedStandard setting, of the $100,000 account | 1% |
| Funded 90-day survivalafter passing, at the Prop-firm safe setting | 100% |
What this means
The funded 90-day row uses the Prop-firm safe setting (0.5% risk per trade). Every other number uses the Standard setting on a $100,000 account, no compounding. The prop-firm challenge has its own box above, with its own setting.
Prop firm challengesettings and notes
On a funded account: use the Prop-firm safe setting. Set Risk % of balance per trade to 0.5.
What this means
Out of 1,800 start days since 2019, each starting from a flat account; 222 of them start in 2024–26, after the setting was chosen. "Failed" is the share that hit the 5% daily or 10% total loss limit. Typical time is for the runs that passed.
What it looks for: the textbook setupThe textbook setup, on a real chart · the bot trades the tested version
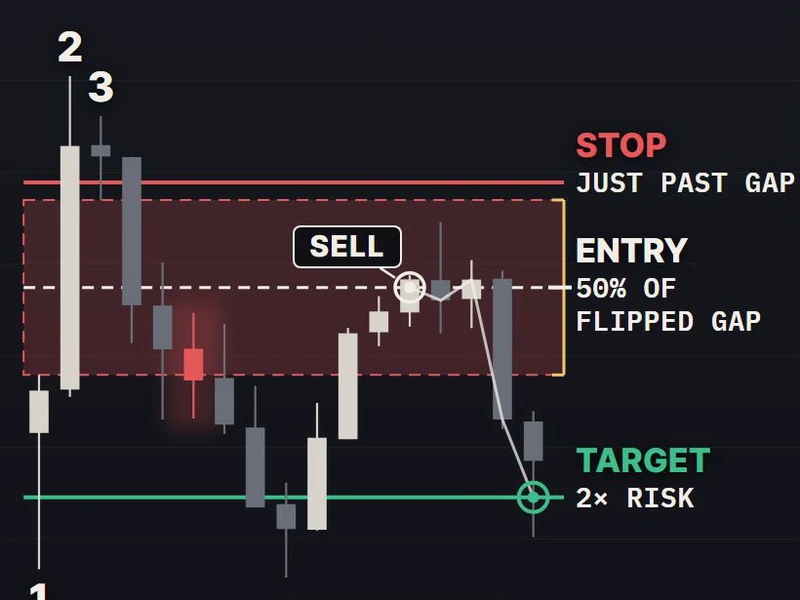
The textbook setup, on a real chart · the bot trades the tested version
Included in Pro. Compare memberships →